
News

BroadScan Software GUI Update

Broadsens's ultrasonic devices such as BroadScan D110C, BroadScan D100 and BroadScan D200 have been using the same software GUI in the past seven years. This year, we decided to give it an upgrade. The upgrades includes the following:

  1. 80% faster data acquisition speed. The underlying ultrasonic program gets a huge performance boost. Structural scan is more than 80% faster than before. A scan of more than 30 steps with sampling points of 8,192 can be done in several seconds now.
  2. Automated temperature compensation and baseline selection. At algorithm side, temperature compensation is automated and the baseline is automatically based on the temperature. The software also incorporates intelligent algorithm to add new data with temperature value outside the current database into the baseline. The algorithm differentiates the variance caused by temperature change or structural change.
  3. Combined GUI for other sensors such as vibration sensors, distance sensors and strain sensors.
  4. Vibration trend analysis ability with selectable time span from "live data" to "one year". This enables user to quickly tell the vibration trend of the monitored structure/machines.
  5. Integrated time-series database. A new time-series database is used to save damage index, ultrasonic sensor status, vibration velocity, vibration RMS value, distance, strains and temperature measurements.


New ultrasonic scan GUI for SHM

New ultrasonic scan GUI

With the new GUI design, baseline data selection is much easier and faster than before. Data file can be selected quickly from the dropdown menu too. Moreover, user can adjust the analysis window intuitively and the variance is shown instantly with the analysis windows adjustment. In the old software, analysis window value has to be adjusted by editing a separate set up file.

User can start ultrasonic scan manually. Ultrasonic scan can be automated by using the combination of a timer, plus a scan interval.

Multiple projects can be created by an user for different structures/machines. Project can be toggled quickly from the dashboard too.

In the newly designed multi-sensor GUI, vibration analysis is added. Vibration analysis focus on easy usage, so that two most commonly used vibration parameters (vibration speed and vibration RMS) are selected. In the vibration trend analysis, the maximum value of vibration speed and vibration RMS is selected in each small interval, so that the worst case condition of the machines/structures can be identified by users. Other sensors such as distance sensor, strain sensors (up to 4 strain gauges can be used), and temperature sensor are also displayed in the unified GUI.

User can select to see the "live data", in which case sensor data updates quickly to show the live status. Then a user can select to view one day's data, or one week's trend, up to 1 year's trend. This helps identify machine or structure defects quickly.

Multisensor interface with vibration trend period selection

Multisensor interface with vibration trend period selection

Finally, the vibration sampling is boosted from the default 50Hz up to 400Hz. Moreover, the vibration data acquisition is continuous, compared to periodic with big gaps in the middle. The vibration analysis is performed automatically with thousands of times more data than before, which makes the vibration trend much more powerful than before. This improvement benefited from our expertise of ultra-low power wireless vibration sensors and vibration analysis algorithms.

Live FFT Mode and Single FFT Mode

Vibration ( acceleration ) amplitude can be analyzed in the frequency domain (or spectrum) to gain a deeper understanding of the vibration profile. Most vibration analysis will typically be done in the frequency domain. A discrete Fourier transform (DFT) computes the spectrum, but nowadays this has become synonymous with the fast Fourier transform (FFT), which is just an efficient algorithm for the DFT. FFT analysis and advanced filtering can be done in the FFT analysis page of the BroadVibra software. It turns out that some applications need to review the time domain waveform and frequency domain waveform in real-time. Therefore, Broadsens recently added live FFT function, that can show the wireless vibration sensor's FFT result in almost real-time.

To use the live FFT function, please choose "Live FFT" data acquisition (DAQ) mode. Multiple wireless vibration sensors can take data at the same time. In the right figure, there are four wireless vibration sensors taking data in live FFT mode. In live FFT mode, when there are multiple sensors, then all sensors are synchronized to take data at the same time. That is, if a wireless vibration sensor connects to the wireless gateway first, then the sensor will wait for the other sensors to connect to the gateway. When all sensors in the same group are connected to the wireless gateway, then they start taking data at the same time. When all sensors finish taking data, the gateway will perform FFT analysis for all sensors in the same group, display both the time domain waveform and frequency domain result. Then the gateway issues another command to the sensors to take data again. Since all sensors are connected to the gateway already, they will take data immediately without waiting.


Live FFT analysis of vibration signal

Live FFT analysis of vibration signal

If there is only one sensor in the group, then the sensors starts taking data immediately when it connects to the gateway.

In single FFT mode, all wireless vibration sensors in the same group are synchronized to take data once, and the FFT analysis result is shown in the bottom chart (Figure 22). If there is single sensor in a group, then the sensor takes data immediately after it connects to the gateway. Temperature is still measured and saved in the database, but will not show in the bottom chart.

Sampling rate, DAQ points and acceleration range can be adjusted at single FFT mode. If MQTT FFT switch is enabled, then the FFT result is transmitted via the MQTT broker to a remote server. The FFT result is in JSON format.
Single FFT mode is to help user quickly look at the FFT result and checks out the machine condition. User can still go to “FFT analysis” page and perform the FFT analysis, and export the FFT result and time-domain data into CSV file. There is no filter added in the single FFT mode. To apply a filter to the data, then it needs to be done at the “FFT analysis” page.

Wireless Vibration Analysis Software Improved Live Data Display

One important feature of Broadsens's ultra-low power wireless vibration sensors is the live data display ability. Vibration curves of multiple triaxial  wireless sensors can be observed in real time through a web browser remotely. This feature help vibration analysts know what is going on with the machines immediately. Traditionally, live data view is only available to wired sensors, or power hungry WIFI sensors. Broadsens's innovative technology enables live data view with long-lasting battery life.

Recently, live data view gets a big boost: more than 10 times more data can be observed in live-view mode with BroadVibra vibration sensor control and analysis software. The new display interface shows a lot more details than before. You can also zoom in the vibration curves to see more details. Detailed vibration data view has to be done in history data review before this update.

Wireless vibration sensor data live display

Wireless vibration sensor data live display

In the left figure, there are four ultra-low power wireless vibration sensors taking data in synchronized multi-DAQ mode. In synchronized DAQ mode, all sensors in the same group start taking data at the same time. Two SVT300-A sensors and two SVT400-A sensors take data at fixed sampling rate of 3.2kHz. In each iteration of DAQ, 2,048 sample points (adjustable) are taken. The process repeats itself until user stops the process, or automatic timers turns off the DAQ.

The sample points can be adjusted from 2,048 up to 16,384 points, which can be used for vibration FFT analysis. Data are saved in time-series database in default. Each gateway can control multiple wireless vibration sensor groups. In each group, there could be multiple sensors.

Wireless vibration data can be sent out to local servers or cloud servers in real-time by turning on the data transfer switch. The default data transfer protocol is MQTT, which is based on TCP/IP interface. Besides vibration data, temperature data are also collected in a much slower rate, since temperature changes much slowly. It is desirable to have both vibration and temperature information for machine condition monitoring and predictive maintenance.

Multichannel Ultrasonic Thickness Gauge UT200S Improvements

The popular multichannel ultrasonic thickness gauge UT200S is ideal for robotic-based structure inspection such as thickness measurements. UT200S gets a performance boost recently. There are two major improvements for UT200S:

  1. Improved auto gain adjustment ability. UT200S comes with automatic VGC (Voltage Gain Controller) adjustment ability, which allows it to adjust the gain automatically by clicking a button. Thickness measurement with UT200S is easy with little calibration required. The new upgrade provides more accurate auto gain than before. Before the upgrade, when a probe is not connected to a channel, the auto VGC may accidently set the gain to the maximum value, which could increase the interference to other ultrasonic channels. The new firmware update uses filtered signal for the VGC checking, which removes the environment noise that could affect the automatic gain adjustment accuracy.
  2. Improved echo-echo mode for high thickness structures. For thick structures, UT200S provides the ability to add receive delays to expand the measurement range effectively. Another option is to increase the sampling points, which can also improve the thickness measurement range. For thick structures, sometimes there is unwanted small echo signal between the true echo signals. This improved echo-echo mode removes this small unwanted disturbance automatically, hence giving more consistent results.
Ultrasonic thickness gauge UT200S front view

UT200S with enclosure front view

Ultrasonic thickness gauge UT200S back view

UT200S with enclosure back view

Broadsens will continue improving UT200S for ultrasonic automatic inspection industry. UT200S can also be used for online monitoring with the automatic measurement ability. API examples and source codes are provided for customer to develop their own control software for multichannel ultrasonic measurements.

Wireless Vibration Sensor Magnet Mounts and 64-bit OS

We have two good news to share with everyone: The first news is that we have limited stocks of magnet mounts for our ultra-low power wireless vibration sensors available now. The second news is that 64-bit OS of the wireless gateway is ready to use, which improves the performance of the wireless gateway significantly.

There have been strong demands of magnet mounts for our wireless vibration sensors. Though magnet mounts have drawback of attenuating high frequency signals, they are very convenient to use. You just need to screw the wireless vibration sensors to the magnet mount base, and attach the sensor with magnet mount to machines to be monitored. The whole process takes less than a minute.

The weight of the magnet mount is 45g (1.6oz). The height of the magnet mount with H-shape legs is 17.7mm (0.7inch); Its diameter is 26mm (1.02 inch). The top of the magnet mount has M6 screw that can be screwed into the bottom of Broadsens's SVT-A series wireless vibration and temperature sensors directly. The H-shaped legs allow the sensor to be mounted to both flat or curved structures easily. To use the magnet mounted sensor, please make sure to slowly touch one leg of the mount to the structure surface, and then slowly lower the other leg to the structure to avoid shocks to the wireless vibration sensors.

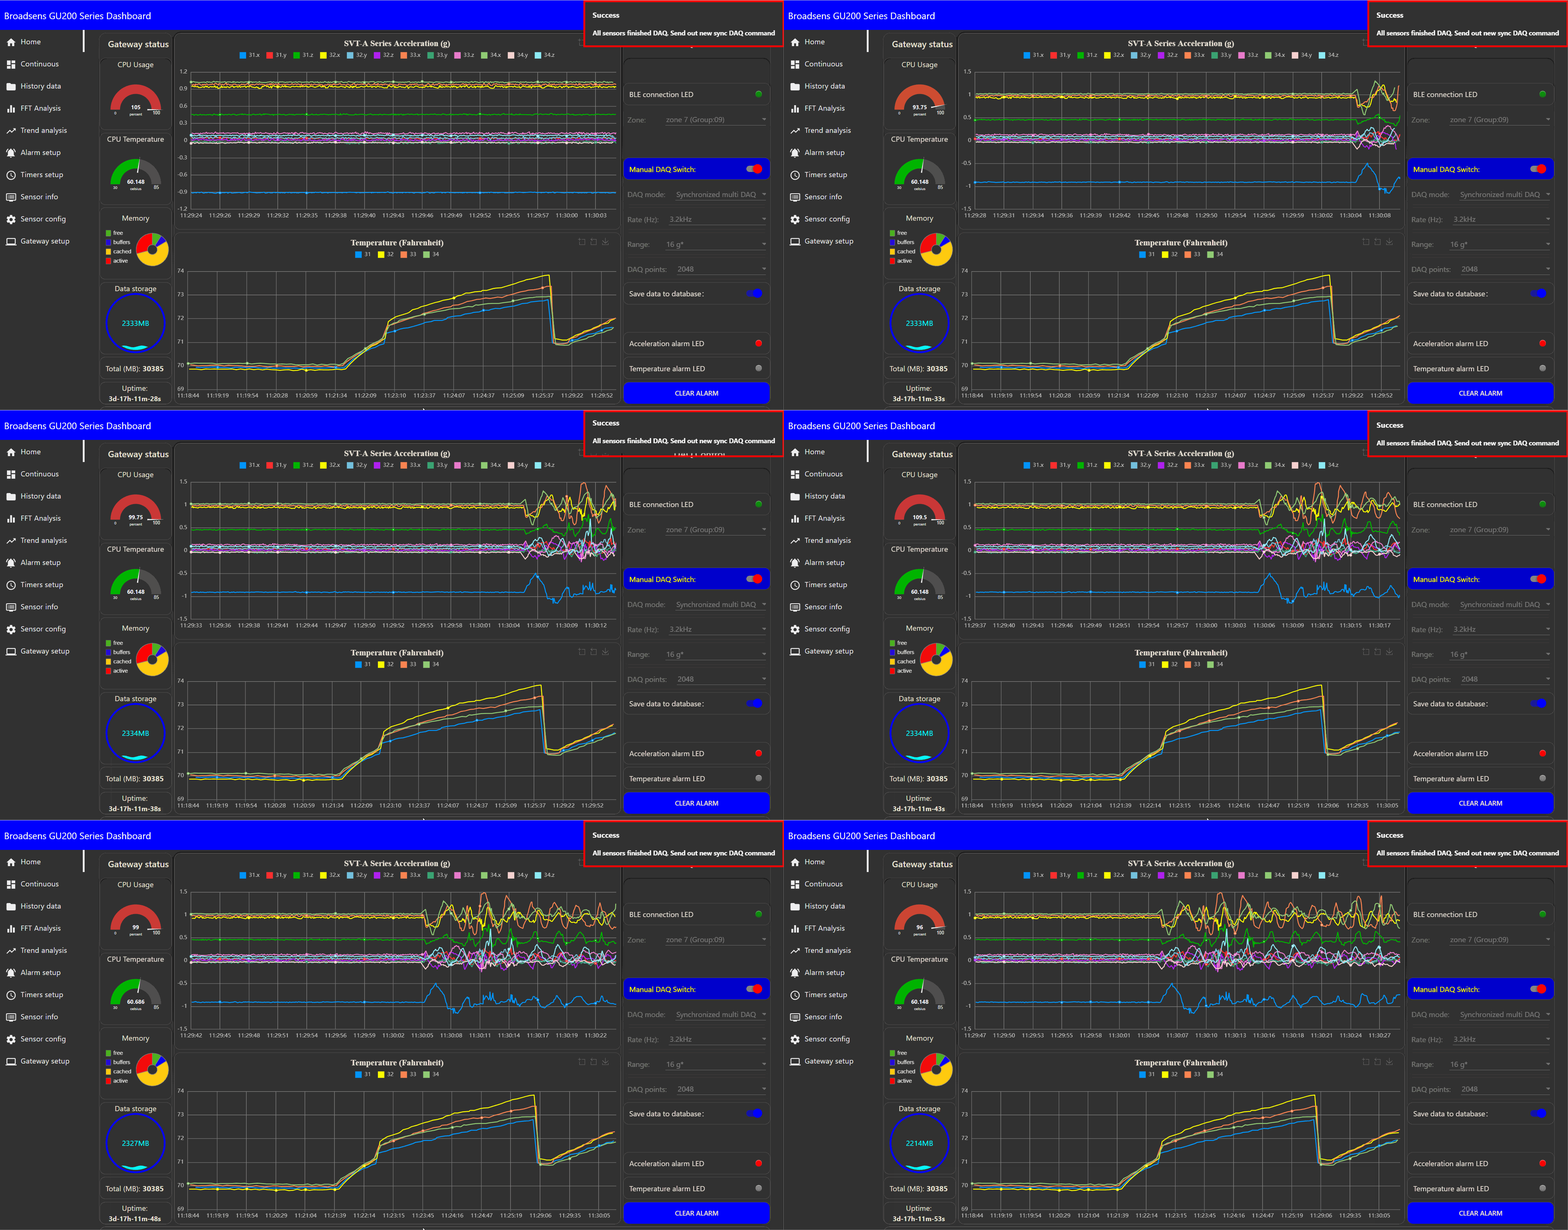
Broadsens's wireless gateways have Linux OS installed with edge computing ability. The new 64-bit OS improves the wireless gateway's performance significantly when a user wants to take data of multiple wireless vibration sensors  continuously for a long time. Per our testing, the 64-bit OS allows GU200S with 2GB RAM to take data of four sensors at 3.2kHz sampling rate non-stop for more than two days smoothly. With original 32-bit OS, it is recommended to not take data continuously for more than 2 hours, or to use MQTT protocol to send out raw data in real time to a more powerful  server to take data (in this case, there is no limit on how long a user takes data). Users can download the new 64-bit OS image from the links provided by Broadsens.

vibration sensor magnet mount top view

Magnet mount top view

vibration sensor magnet mount bottom view

Magnet mount bottom view

Posts navigation

1 2 3 4 5 6 7 8 9 10 11 12